Visualizing The Nobel Prize Winners
My book Data-visualization with Python and JavaScript uses a freshly scraped, cleaned and refined Nobel-prize dataset to build a JavaScript web visualization, with D3 doing the heavy-lifting. The visualization is shown below:
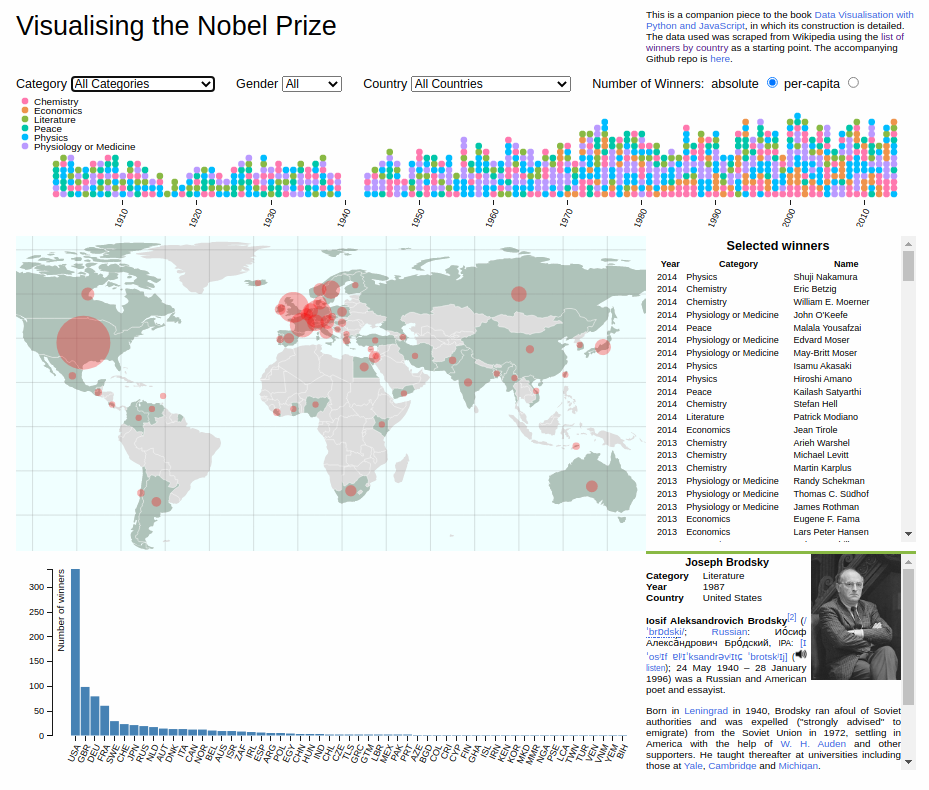
Using a combination of charts the dataviz app allows you to explore the Nobel-prize dataset looking for interesting stories in the data. One of the book chapters demonstrates data exploration with a Python Jupyter notebook, using Pandas and Matplotlib to ask questions of the data and find some interesting and surprising stories. See Exploring Data with Pandas and Matplotlib.
Check out the Nobel-winners’ visualisation here